Now that we’re past the first round of our group projects, we’re looking into how we can best assist WKSU, Kent State’s NPR station, with creating multi-layered and engaging content based off of our reporting. The best way to do so? With data, of course!
Data collection can help reporters in lots of ways– and one important idea is that looking through data can actually provide journalists with jumping off points and story ideas. Picture this, for example… you’re looking through a hypothetical budget and see some outliers. Your questions might become: What’s up with that? How can we investigate further? We’ve also been emphasizing the power of data collection and interpretation in class. So, it seems, that’s the overarching idea we’ll be pursuing from here on out.
Luckily, we have a nice starting point with sea lampreys. If you recall, in our story, we have a map of sea lamprey adult indices in the Great Lakes over the years. Here it is:
This map was created from a large dataset provided to us by Marc Gaden from the Great Lakes Fishery Commission — and there’s lots there! So, why don’t we use this dataset as an example of what is to come by seeing what other information we can glean from it?
Looking at the data, contained in an Excel file, we see… well, lots of numbers. It can be a little intimidating at first, so let’s look at something we’ve already used in the map above: adult indices of sea lampreys in the Great Lakes. In the previous map, we simply provided the population data per lake per year. But we have enough data here to provide this same information in context.
What context, you ask? Well, for this exercise, let’s compare the adult index of sea lampreys in each lake with what was supposed to be the adult index target. We have both sets of data, so it might be helpful if we are able to visualize the disparity between the actual number of adult lampreys per lake versus what was supposed to be the target number for that year.
In order to simplify this, however, let’s just look at the lamprey population data for all measured years in one lake. (We’ll look at Lake Erie, since we are in Ohio.) We could compare each lake’s data, but let’s drill down.
In Tableau, I connected to the Excel file with Lake Erie’s data. I decided I wanted to compare the adult indices of each measured year with the actual population target of Lake Erie, to compare. When we do this, we can see the difference between the actual numbers of sea lampreys in Lake Erie and how many there were supposed to be, according to the Great Lakes Fishery Commission. Here is the chart:
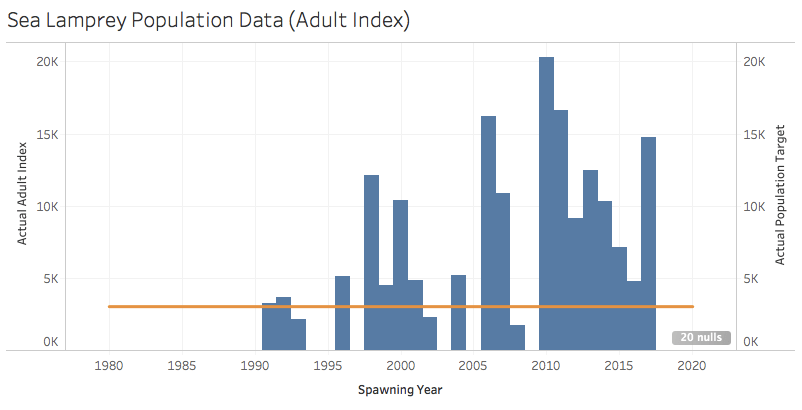
Here, we have a better sense of which years in Lake Erie were particularly bad. (Meaning which years we were very far off of our sea lamprey population target.) The orange line represents the actual population target, and serves as a reference point for viewing the bar graph of actual adult indices of sea lampreys per spawning year in Lake Erie. Plus, it just looks nice! (I’m sure it’s much easier to understand the data when it is in graph form than when it is simply a jumble of numbers in a spreadsheet.)
And, well, I have good news! The data source I pulled from to create this graph is huge! There’s much, much more to be learned from this source, and I’m sure as we continue in our data journey, they’ll be even more to visualize and contextualize.
