While we have been investigating some of the most well-known or prolific invasive species in Ohio, we’ve noticed a pattern. There’s great information out there about invasives, but barely anywhere where that information is conglomerated in a helpful manner.
For example, say you live in Ohio’s Portage County. You want to know some of the invasive species you might need to be on the lookout for. You can find this information through doing some research on the web, sure. But what if you could simply select your county on a map and see a list of some prominent invasive species?
This will be one of the resources in the field guide to invasive species we are creating. In order to make an initial version of this map, however, I created an interactive visualization with Google MyMaps.
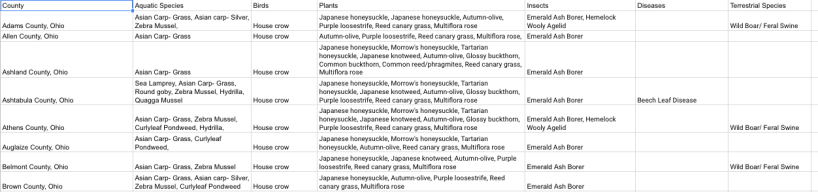
Quite basically, my team and I went through several websites and research items and found images of county maps that depicted the spread of an individual invasive. (Some examples can be found in the Ohio Department of Natural Resources’ Ohio Field Guide to Aquatic Invasive Species.) We then transcribed this information into a spreadsheet. This spreadsheet lists the name of each invasive, some descriptive information, a source for the information and a list of the counties the invasive species is present in. (As well as the year of the information source.)
I then fed this information into another spreadsheet, in which I charted the county and name of the invasive into a format Google MyMaps would be able to Geocode. You can see an example of this formatting below.
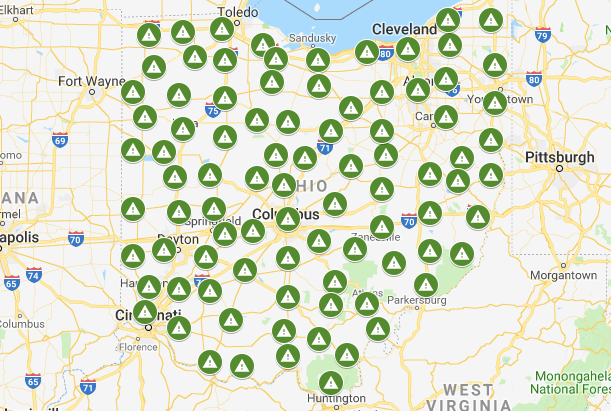
The final outcome of this work is an interactive Google map. When you click on one of the green points, the map will tell you both the name of the county it is positioned on and some of the invasives that can be found in that county. Below is an image of the map, which you can use here.
As this project progresses, we will be developing a more interactive and complete map through Tableau. Check back later for updates!
